This article is about the configuration of trends using InTouch SCADA programming with the help of a tank filling example.
Trends in SCADA / HMI is very useful to track, monitor, calculate, to diagnose useful process parameters from the past saved trend data.
You can keep a record of all the process data in the form of a graph, and it is called a trend.
Let’s learn how to track and generate a trend using Wonderware SCADA.
Step 1:
Open InTouch SCADA. Create a new project.
Step 2:
Here, I will use an example of a tank filling to monitor the level in the tank. I cannot simulate a real-time sensor, so I will add a switch to start filling the tank.
Add tank and switch as shown in the below window. Give tag name to tank and switch. I have explained in my previous article on how to give tag name to an object.
Here, my purpose is to make you familiar with trends, so I will only go through it.
I have added a script to fill and empty the tank.

Step 3:
Here I have used “T” as a tag name for a tank as we want to monitor the level of the tank, we need this tag name.

Step 4:
To add trends mainly you have two options.
Real-time trends (Only works in a real-time environment, If you close the window you will lose the data)
Historical trends (In historical you can store the data and check data at any time)
Here, I will cover both of them. Let’s talk first about adding Real-time trends.
To add trend, click on the “wizard” icon as shown in the below window.
Click on “Trends” and select “16-pen trends”. Hit “ok” to proceed.
Step 5:
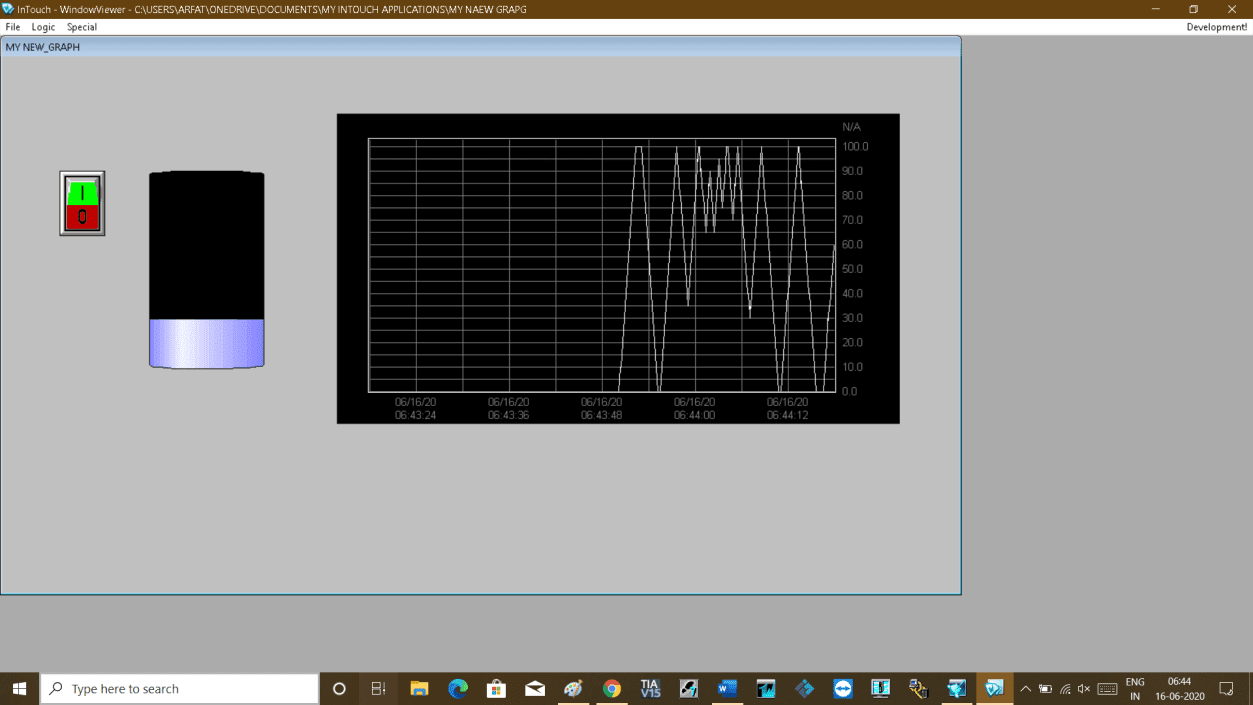
A real-time trend is added to the window.
Step 6:
Double click on trend then a new pop-up will open.
Here 16-pen means you can add 16 types of process variables to trend the data.
Step 7:
Now, double click on the space as indicated in the window that will open a new pop-up.
Find and select a tag name that you want to name the tank. Here I used “T”.
Step 8:
Close the pop-up window and again double click on the same location. Now the tag name “T” is added.
Double-clicking on it will open up a new pop-up.
Do checkmark on “log data” and also change the range as shown in the below window. Click “Done” to proceed.
Step 9:
Now you are done with a Real-time graph. Now we can monitor the tank level by entering in to runtime mode。
Step 10:
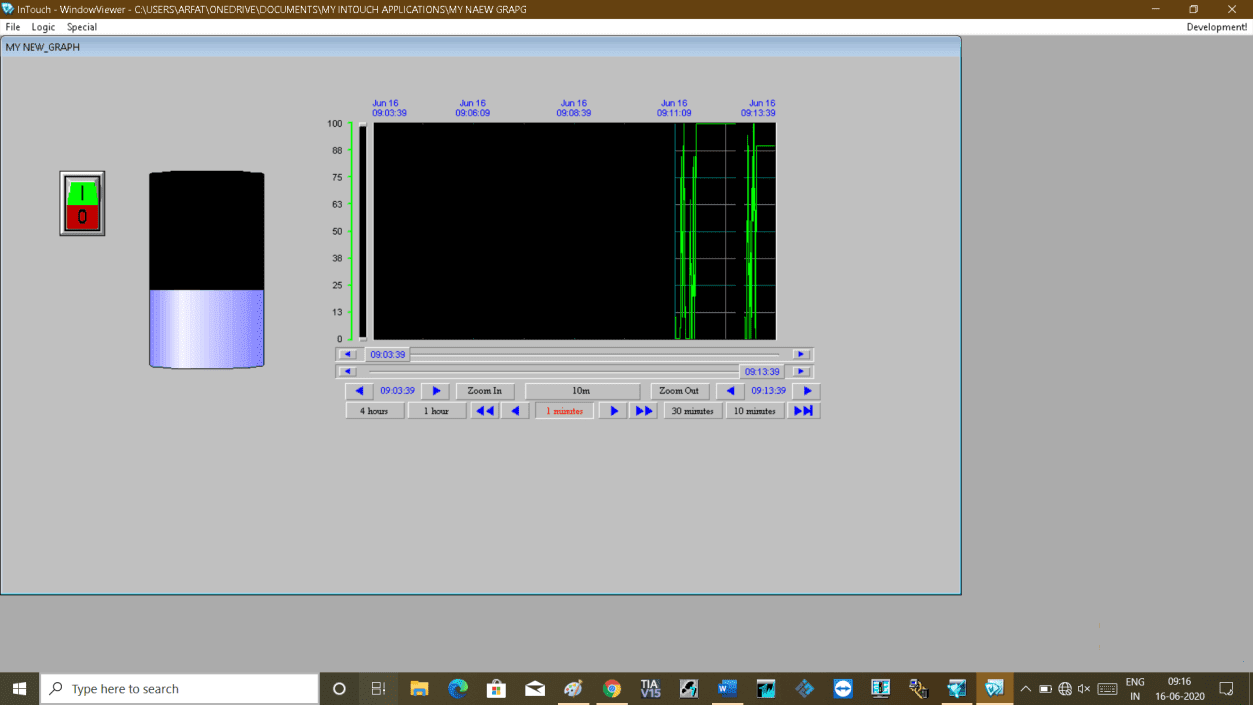
Now I will add a Historical trend as shown in the below window.
Again, double click on the trend to add the tag name of the tank.
Step 11:
The following window will open up. Give any name and click on “pens” to add the tag name of the tank.
Step 12:
Clicking on pens will open up a new window as shown in the below window.
Add tag name to it. Double click on the space where you have added tag name.
Do the right checkmark as shown in the window. Choose range and click “ok” to proceed.
Step 13:
To active Historical logging, do follow the steps as shown in the below window.
Step 14:
Do checkmark on “historical logging” and set days to store the data. It will only store the trend data for this number of days only.
Step 15:
You can see trends in the runtime window.
END


Comments
Post a Comment